Enabling
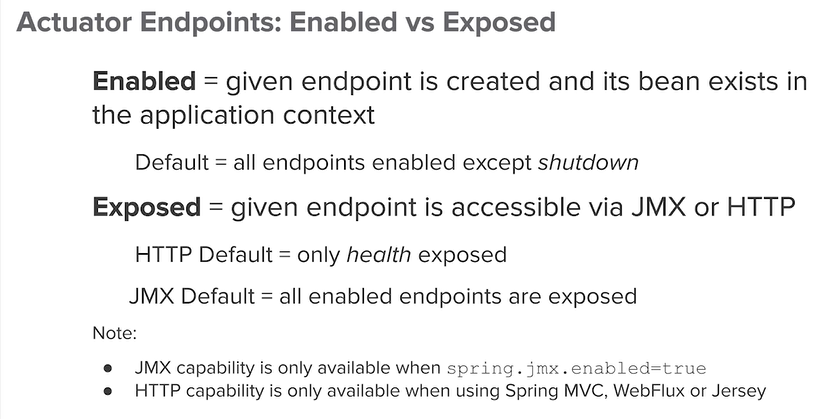
Exposing HTTP Endpoints
#default setup
management.endpoints.web.exposure.include=health

#expose just beans,env,info
management.endpoints.web.exposure.include=beans,env,info

#exclude threaddump
management.endpoints.web.exposure.exclude=threaddump

#expose all endpoints
management.endpoints.web.exposure.incude=*
Enabling Endpoints
#to enable specific endpoints, default configuration must be changed.
management.endpoints.enabled-by-default=false
#enable health endpoint
management.endpoint.health.enabled=true
(management.endpoints.web.include=health)
# Shutdown is disabled by default
# enabling
management.endpoint.shutdown.enabled=true
https://www.baeldung.com/spring-boot-actuator-enable-endpoints
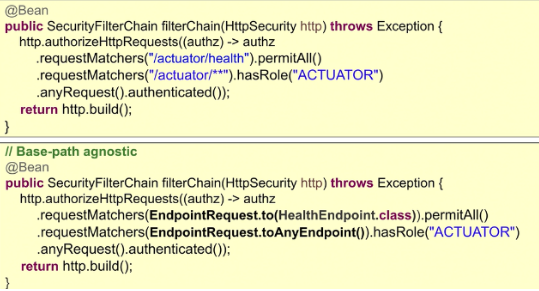
Secure endpoints
Configure spring security.
Health Group indicators
Configure group indicators:
# group health indicators
management.endpoint.health.group.<group-name>.include=<health indicators>

#example
management.endpoint.health.group.system.include=diskSpace,db
management.endpoint.health.group.web.include=ping
Examples outpout:

Status
By default, Spring Boot defines four different values as the health Status:
UP — The component or subsystem is working as expected
DOWN — The component isn’t working
OUT_OF_SERVICE — The component is out of service temporarily
UNKNOWN — The component state is unknown
## Status http mapping
management.endpoint.health.status.http-mapping.UP=200
management.endpoint.health.status.http-mapping.UNKNOWN=200
management.endpoint.health.status.http-mapping.DOWN=503
management.endpoint.health.status.http-mapping.OUT_OF_SERVICE=503

## Severity order
#default order
Status.DOWN, Status.OUT_OF_SERVICE, Status.UP, Status.UNKNOWN

#to change this
management.endpoint.health.status.order= X, Y, Z
https://www.baeldung.com/spring-boot-actuators
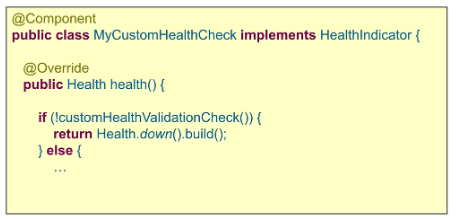
Custom health indicators
Custom health indicators can be added to /actuator/health
- Create a class that implements HealthIndicator interface and override method health().
- Extend AbstractHealthIndicator and override doHealthCheck().
Metrics types
Types
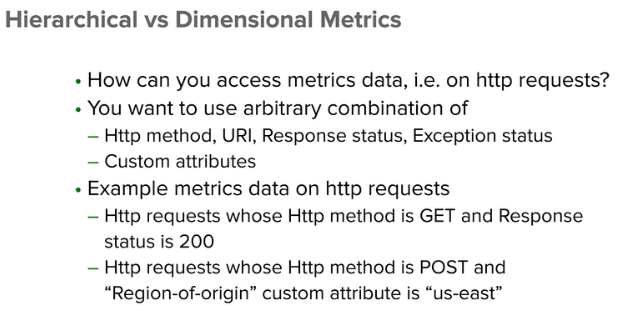
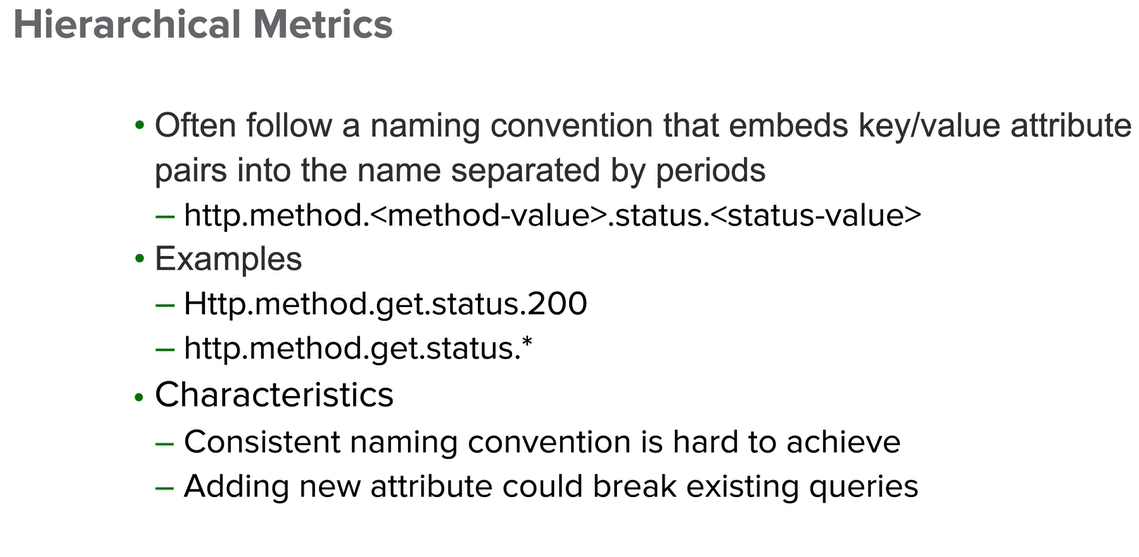
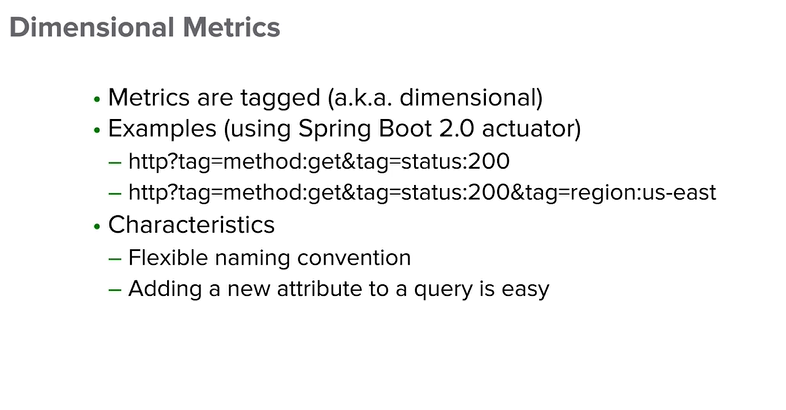
Counter – reports a count over a specified property of an application
Timer – measure latencies or frequency of events in our system.
DistributionSummary – distribution of events and a simple summary.
Gauge – A gauge shows the current value of a meter.
https://www.baeldung.com/micrometer
Endpoints
auditevents – lists security audit-related events such as user login/logout. Also, we can filter by principal or type among other fields.
beans – returns all available beans in our BeanFactory. Unlike /auditevents, it doesn’t support filtering.
conditions – formerly known as /autoconfig, builds a report of conditions around autoconfiguration.
configprops – allows us to fetch all @ConfigurationProperties beans.
env – returns the current environment properties. Additionally, we can retrieve single properties.
flyway – provides details about our Flyway database migrations.
health – summarizes the health status of our application.
heapdump builds and returns a heap dump from the JVM used by our application.
info – returns general information. It might be custom data, build information or details about the latest commit.
liquibase – behaves like /flyway but for Liquibase.
logfile – returns ordinary application logs.
loggers – enables us to query and modify the logging level of our application.
metrics – details metrics of our application. This might include generic metrics as well as custom ones.
prometheus – returns metrics like the previous one, but formatted to work with a Prometheus server.
scheduledtasks – provides details about every scheduled task within our application.
sessions – lists HTTP sessions, given we are using Spring Session.
shutdown – performs a graceful shutdown of the application.
threaddump – dumps the thread information of the underlying JVM.
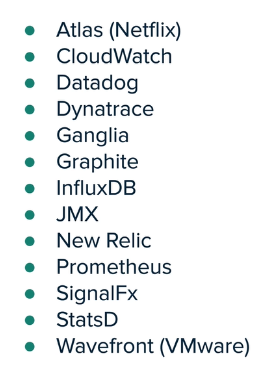
Integrations
